In this blog, I'm explaining how to Use the trace parser tool in D365FO.
Any application at some point faces slow performance issues. It can be due to bad designs, incorrect configurations, or any other reason. The end user experiences slow performance when opening a form. I'm using the Trace Parser to diagnose the issue.
In this article, we will discuss how to collect the trace and import it into the Trace parser.
The Trace Parser tool is located as shown in the figure below.:-

Click on the trace parser to open dialog form as shown in the figure below.
Enter the trace name enable SQL parameters and click on the start trace button.

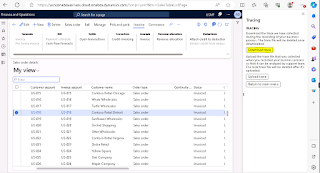
I've opened the BankAccountTable form and am making some customizations to it. At the same time, I'm using the Trace Parser tool to check the methods, SQL round trips, and how many times the code is hit.
- After your activity is completed, stop the trace.

- Download the trace file.
- open the trace parser and run it as an administrator.

- Create a new Database for Trace and click Register.

- the file is imported to trace the parser Tool.

- you can use a trace parser.

- Create a new Database for Trace and click Register.


.PNG)
No comments:
Post a Comment